Kubernetes Course Labs
Lab Solution
My solution uses two new scrape configs, one for cAdvisor and one for kube-state-metrics:
Deploy the change:
kubectl apply -f ./labs/monitoring/solution/prometheus-config.yaml
Trigger a rollout to load the new config:
kubectl -n monitoring rollout restart deploy/prometheus
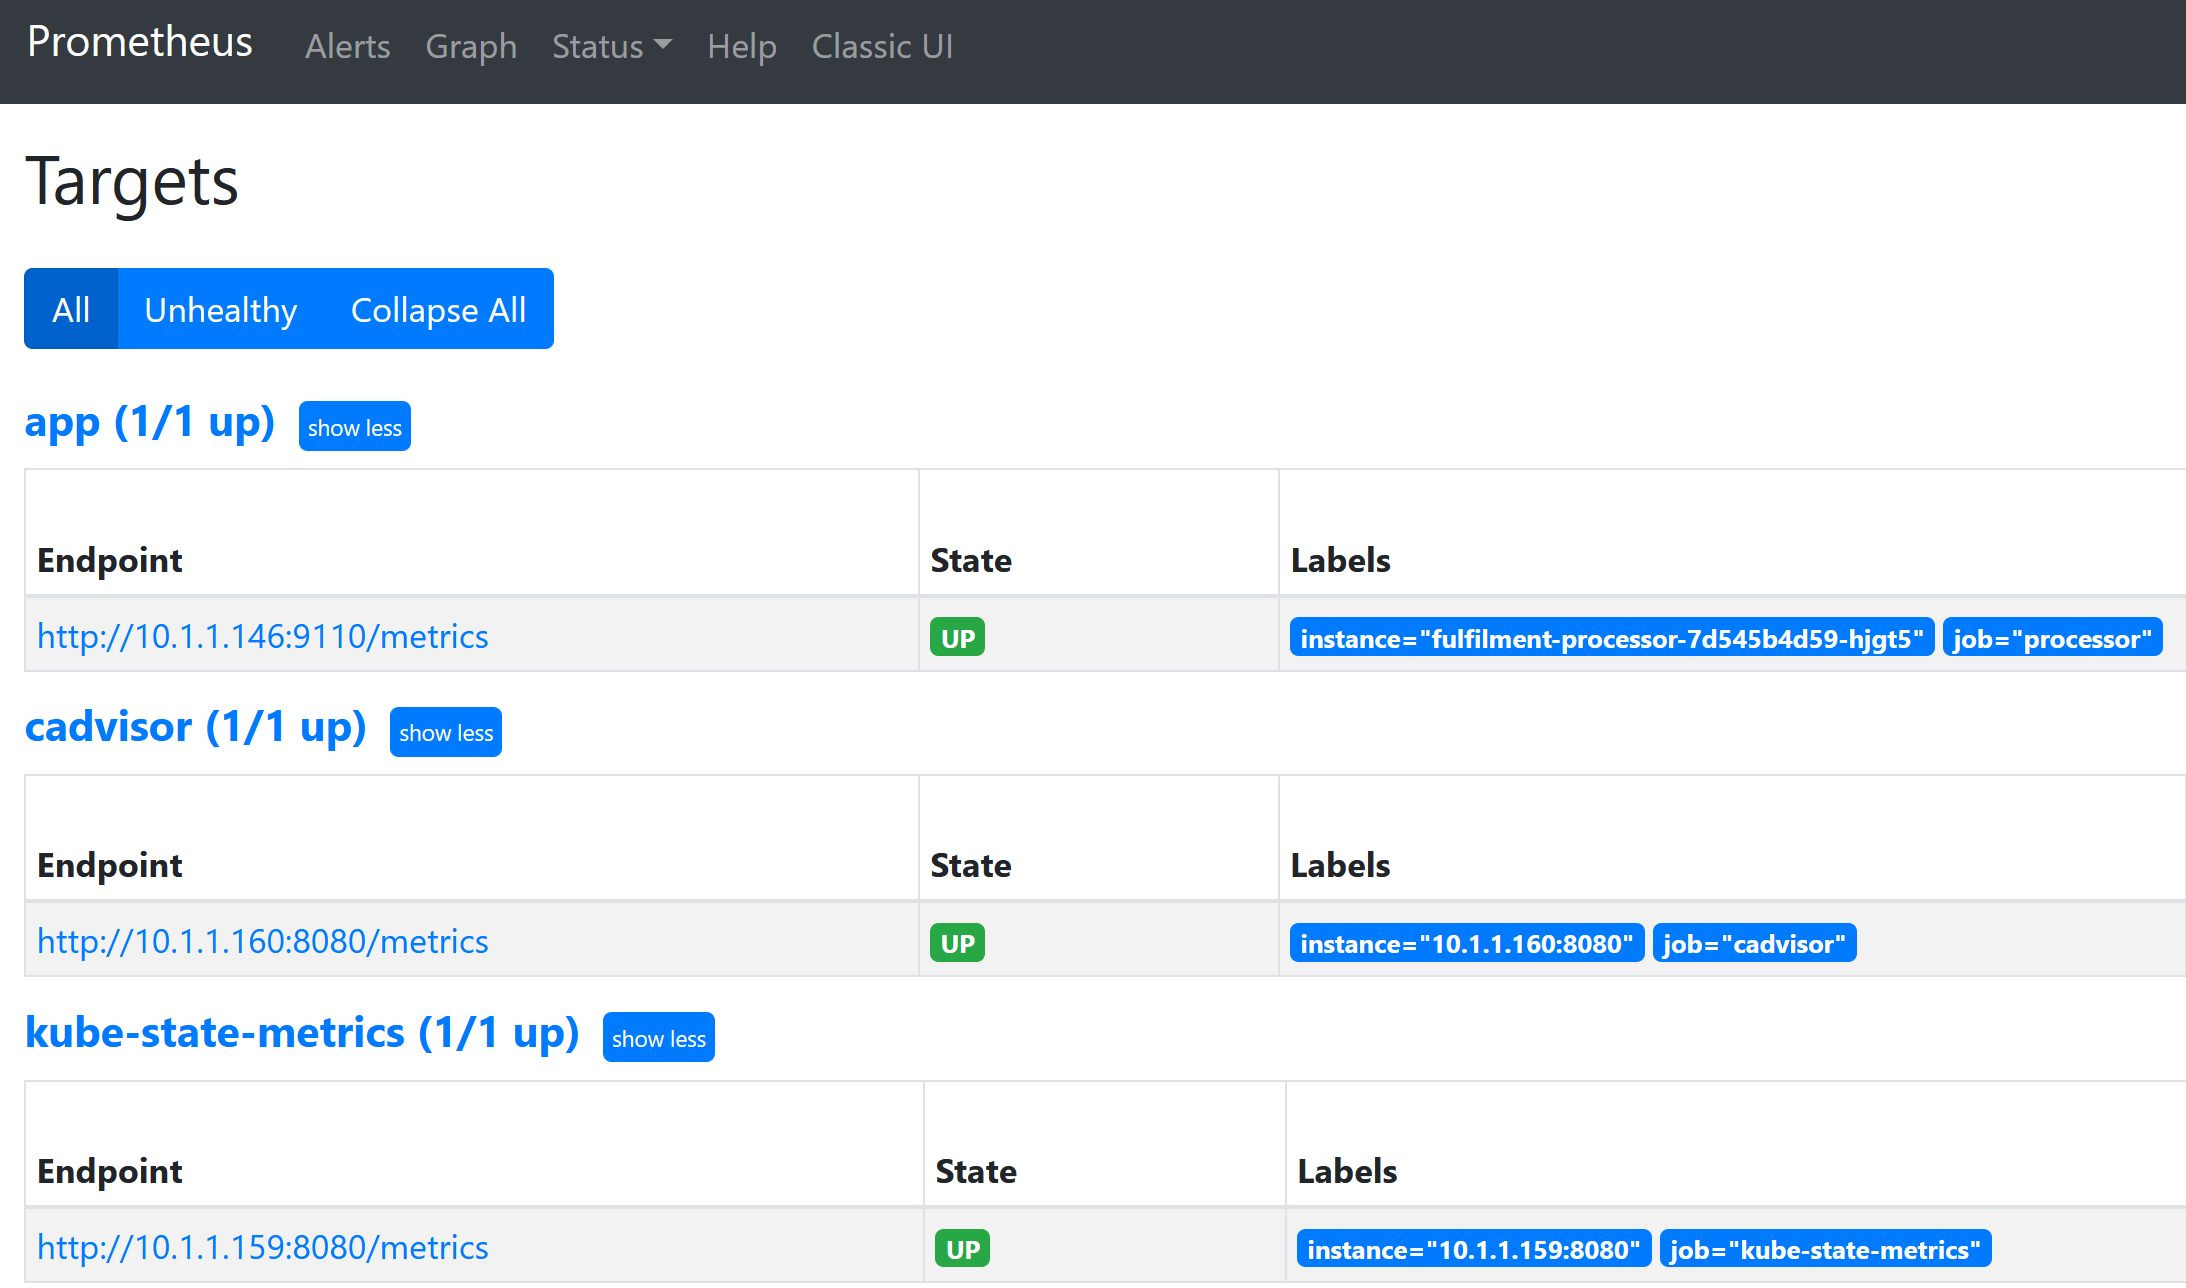
Browse to Prometheus target config check the new targets are up:
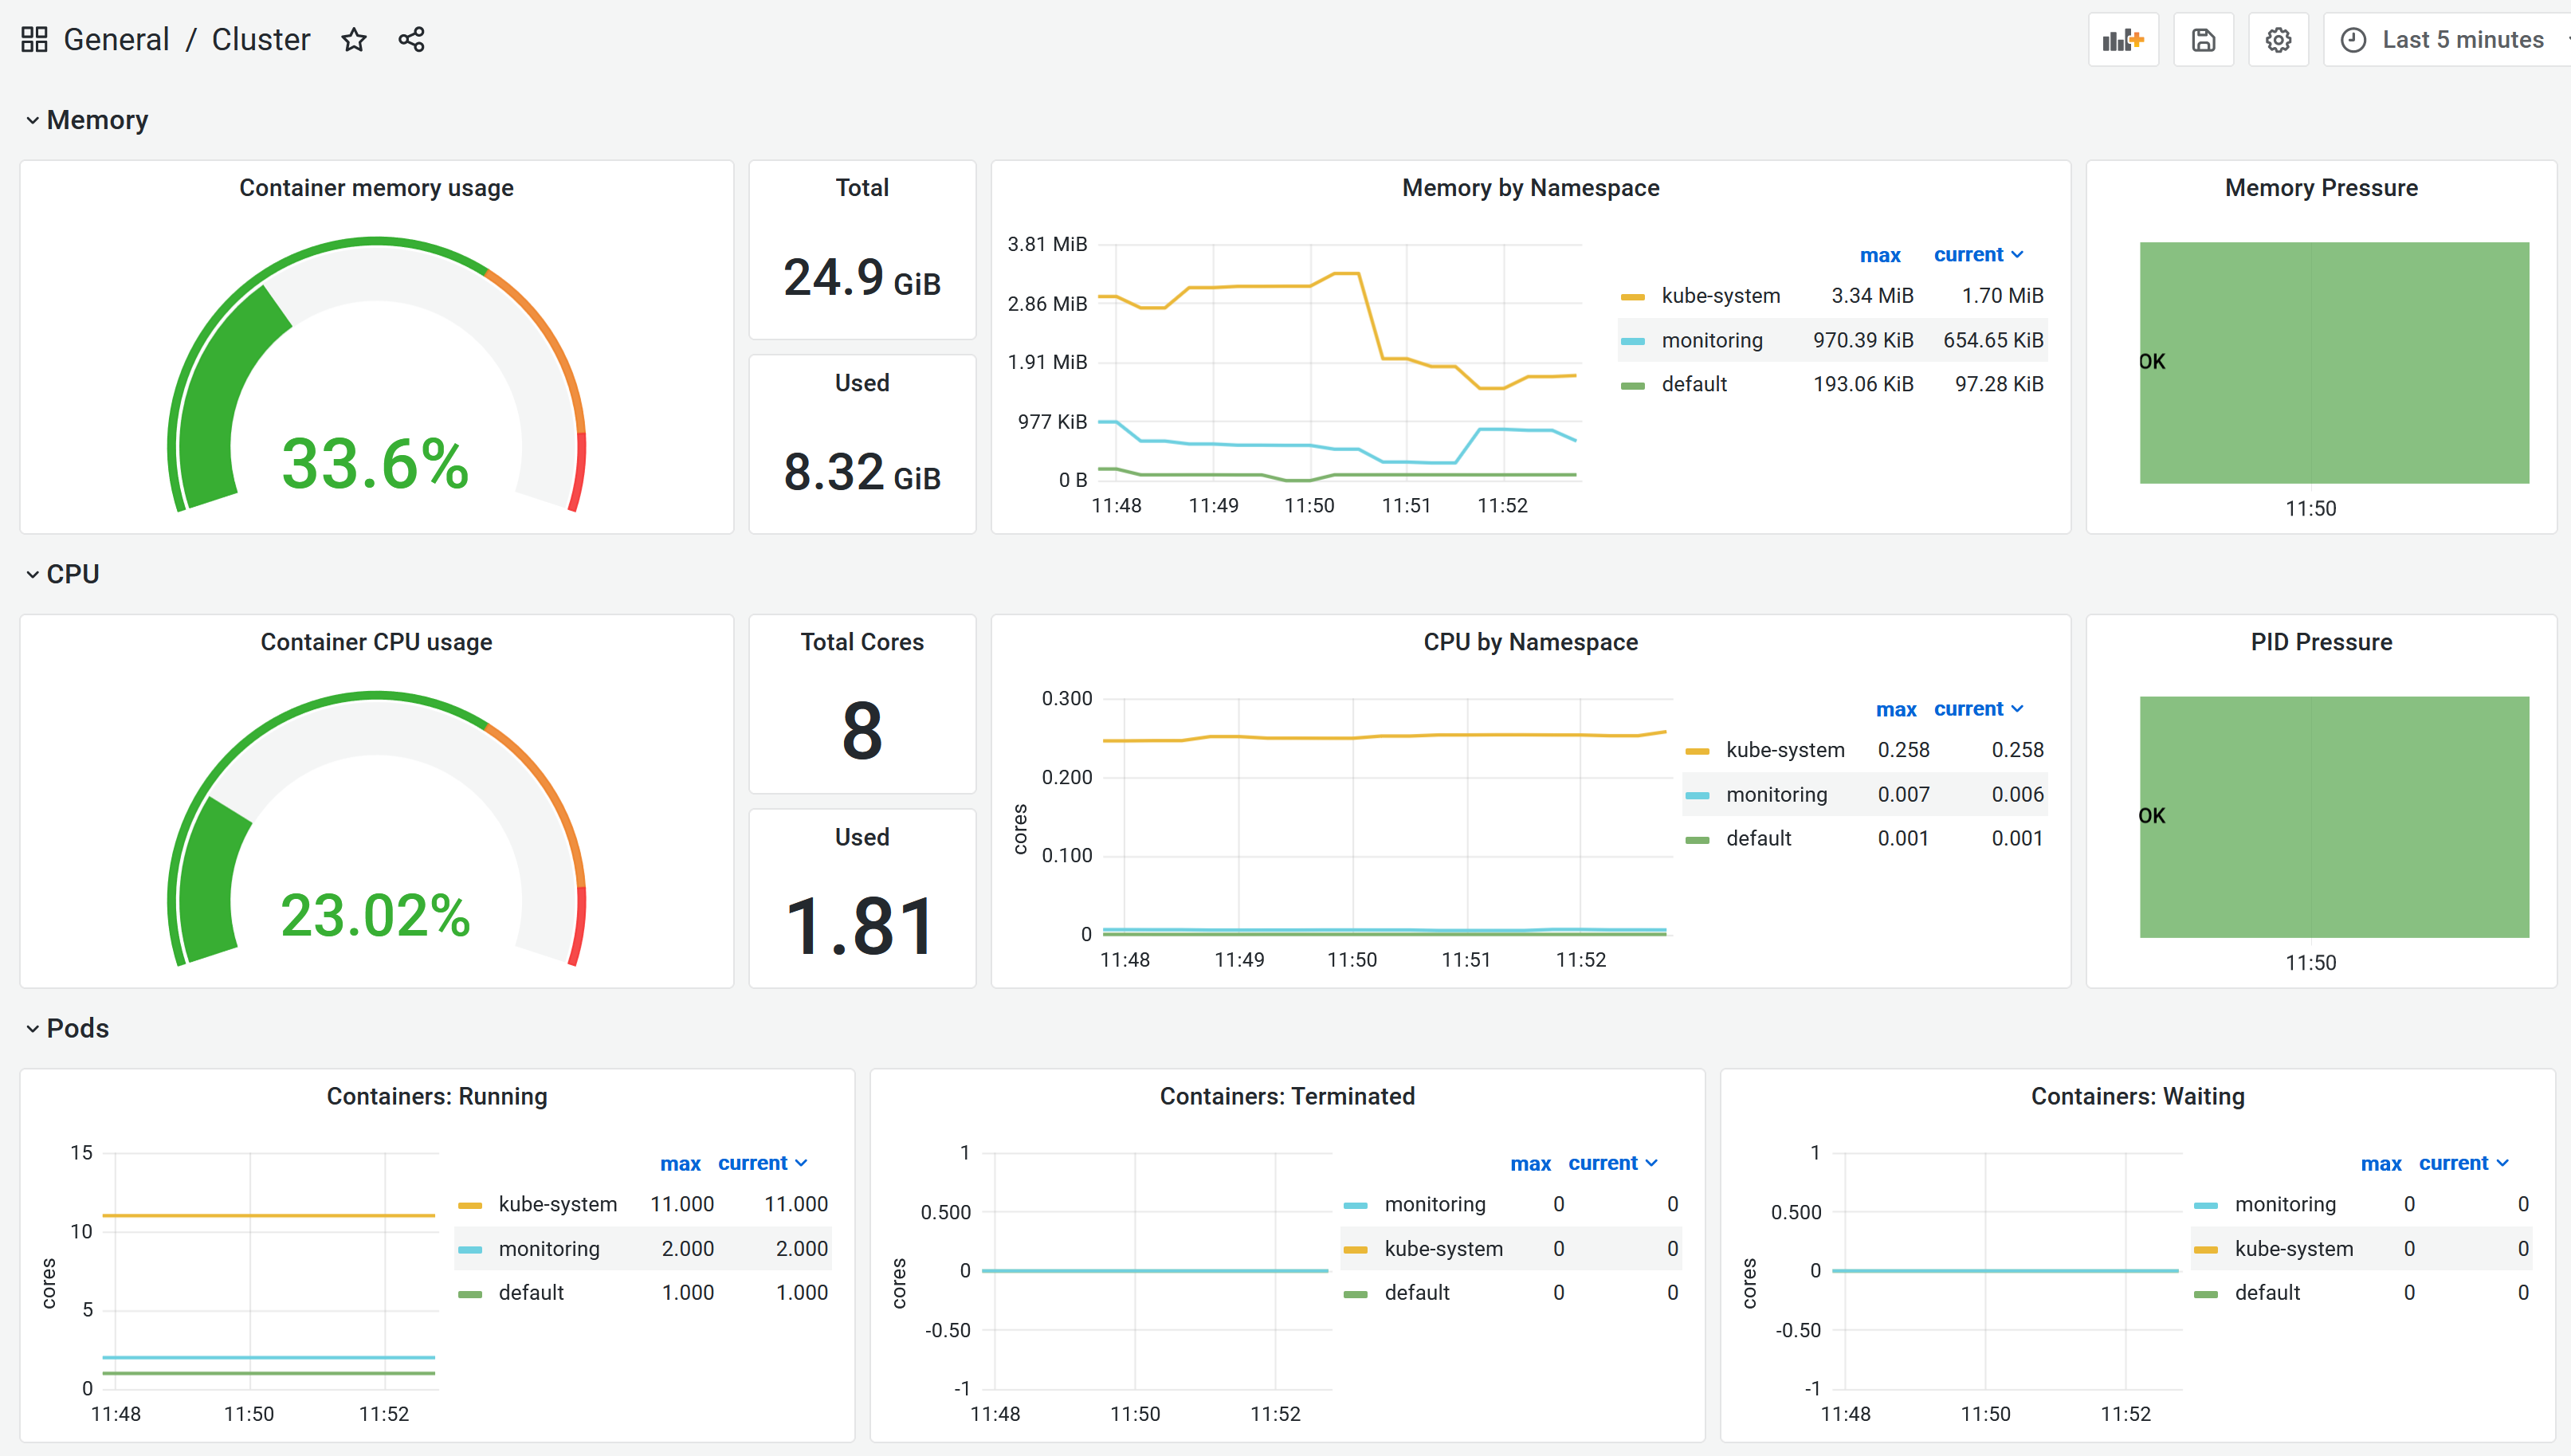
Then load the new dashbaord into Grafana:
Back to the exercises