Kubernetes Course Labs
Monitoring with Prometheus and Grafana
Kubernetes can run hundreds of containers across dozens of servers. To keep track of them you run a monitoring server like Prometheus which collects metrics from all of your containers. Prometheus stores the data and lets you query it - and you can visualize dashboards using Grafana.
Reference
- Helm chart for installing Prometheus
- Configuring Kubernetes service discovery
- Prometheus client libraries and exporters
The Prometheus server runs in a Pod and connects to the Kubernetes API to find other Pods. You can configure service discovery to be opt-in (no Pods monitored by default), or opt-out (all Pods monitored by default). Application Pods use annotations to configure how they need to be monitored.
This is what the Prometheus YAML config looks like:
scrape_configs:
  - job_name: 'app'
    kubernetes_sd_configs:
      - role: pod

    relabel_configs:
      - source_labels:
          - __meta_kubernetes_namespace
        regex: my-app
        action: keep

      - source_labels:
          - __meta_kubernetes_pod_annotationpresent_prometheus_io_scrape
          - __meta_kubernetes_pod_annotation_prometheus_io_scrape
        regex: true;true
        action: keep
-
kubernetes_sd_configssets Prometheus to look for all Pods -
relabel_configslooks at the Pod metadata, and only includes Pods to scrape if they are in the my-app namespace and have the annotation applied
This Pod spec would be included in the scrape configuration:
kind: Pod
metadata:
  name: whoami
  namespace: my-app
  annotations:
    prometheus.io/scrape: 'true'

spec:
  containers:
    - name: app
      image: sixeyed/whoami:21.04
Other annotations can be used to configure the port and HTTP path Prometheus should use to collect metrics.
Deploy an application which publishes metrics
This is a background processing app which is built with Prometheus support:
- fulfilment-processor/deployment.yaml - includes the Prometheus annotations
Deploy the app:
kubectl apply -f labs/monitoring/specs/fulfilment-processor

kubectl get all -l kubernetes.courselabs.co=monitoring
When the Pod is ready, browse to the metrics endpoint on http://localhost:9110/metrics or http://localhost:30910/metrics
This is not a web app - it runs an HTTP server purely to provide the metrics. Refresh the page and you'll see some of the numbers changing:
fulfilment_in_flight_totalis a gauge, the number can increase or decreaseprocess_cpu_seconds_totalis a counter, the number will only increase (or stay the same)
This is the raw monitoring data which Prometheus will collect.
Deploy the monitoring stack
We'll use a separate namespace for monitoring:
-
prometheus.yaml - specs out Prometheus to run in a Deployment, with Services to access the web UI and RBAC rules to give access to the Kubernetes API
-
prometheus-config.yaml has the Prometheus configuration for discovering Pods
📋 What setup do Pods need so that they're included in the Promtheus discovery?
This is an opt-in configuration. Pods need to:
- run in the
defaultnamespace - have the annotation
prometheus.io/scrape: 'true'
The fulfilment processor Pod matches the discovery configuration, so Prometheus will start scraping metrics when it finds the Pod.
📋 Deploy the monitoring components and browse to the /targets path for the Prometheus Service.
Deploy the specs:
kubectl apply -f labs/monitoring/specs/monitoring
Check the Service setup:
kubectl get svc -n monitoring
Browse to http://localhost:9090/targets or http://localhost:30990/targets
You'll see the fulfilment processor Pod listed - it should be in the Up state.
Switch to the Graph page and check out some metrics:
-
enter
fulfilment_requests_totalin the Expression panel to see the current data; then switch to Graph view to see data changing over time -
do the same for
fulfilment_in_flight_total
You'll see one set of graph lines always increases, and the other goes up and down.
The expressions use a custom query language called PromQL. It's useful to try your queries out in the Prometheus UI, but it's not a full visualization tool - for dashboards you'll use Grafana.
Load the app dashboard into Grafana
Grafana connects to Prometheus - the deployment uses ConfigMaps and Secrets so the UI is already configured:
-
monitoring/grafana-config.yaml - sets up Prometheus as a data source which Grafana can query
-
monitoring/grafana.yml - contains a Secret for the admin user credentials.
📋 Browse to the Grafana UI and log in as the admin user.
Check the Service to find the port:
kubectl get svc -n monitoring
Print the plain text details of the Secret:
# find the variable names:
kubectl describe secret -n monitoring grafana-creds

# print admin username:
kubectl get secret -n monitoring grafana-creds -o jsonpath="{.data.GF_SECURITY_ADMIN_USER}" | base64 -d

# print admin password:
kubectl get secret -n monitoring grafana-creds -o jsonpath="{.data.GF_SECURITY_ADMIN_PASSWORD}" | base64 -d
Browse to http://localhost:3000 or http://localhost:30300 and log in with username admin and password labs.
Now we're ready to load the application dashboard - we have a ready-made one we can import. Click on the + icon in the left navigation and select Import.
Click Upload JSON file and browse to your course repo, to load the file labs/monitoring/dashboards/fulfilment-processor.json.
Click Import and the dashboard will load. It looks something like this:
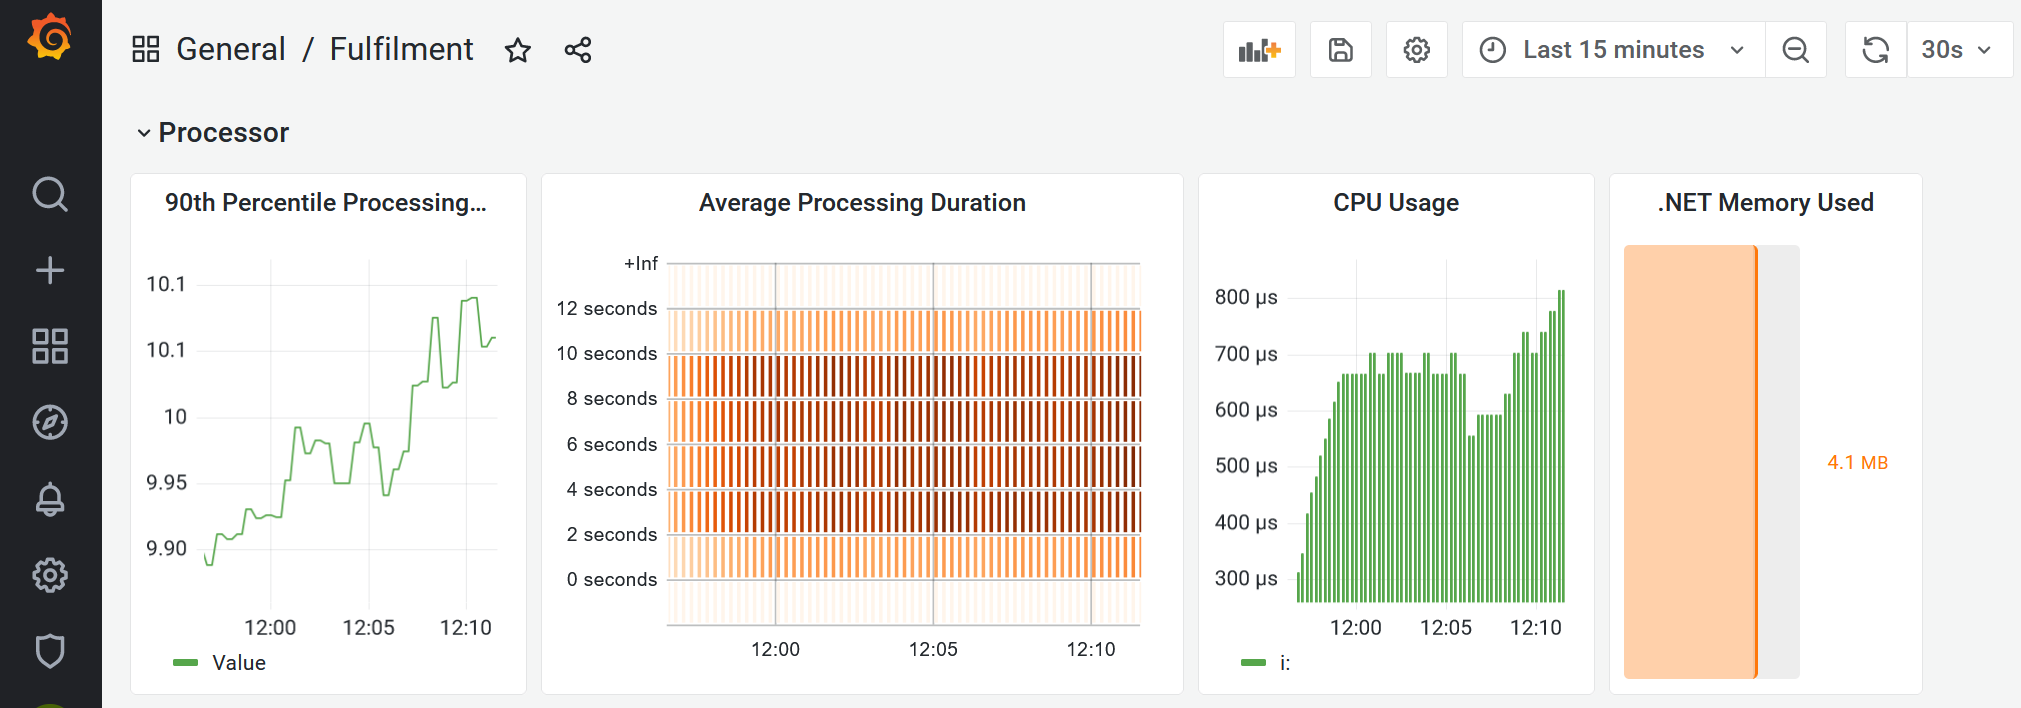
All those graphs are being powered by the simple numeric metrics from the Pod. Grafana is not super user-friendly. You can click the title bar of any of the graphs and select Edit to see the PromQL query.
Lab
Application metrics are only one part of monitoring - you'll also need to see a lower level of detail to show you how the cluster is performing.
cAdvisor and kube-state-metrics are open-source tools for exporting container and cluster metrics for Prometheus . We want to run these metrics components and see the data in Grafana.
Start by deploying the metrics servers:
kubectl apply -f labs/monitoring/specs/cluster-metrics
Check the metrics Pods:
kubectl get pods -l kubernetes.courselabs.co=monitoring -A
They aren't being scraped by Prometheus yet because they don't match the discovery rules. We don't want to change the Pod definition because it's standard, instead we'll extend our Prometheus setup. To load the data you'll need to:
-
update the Prometheus service discovery configuration to include these new Pods.
-
reload the Prometheus server to pick up the new configuration.
-
import the cluster dashboard into Grafana from the file
labs/monitoring/dashboards/cluster.json
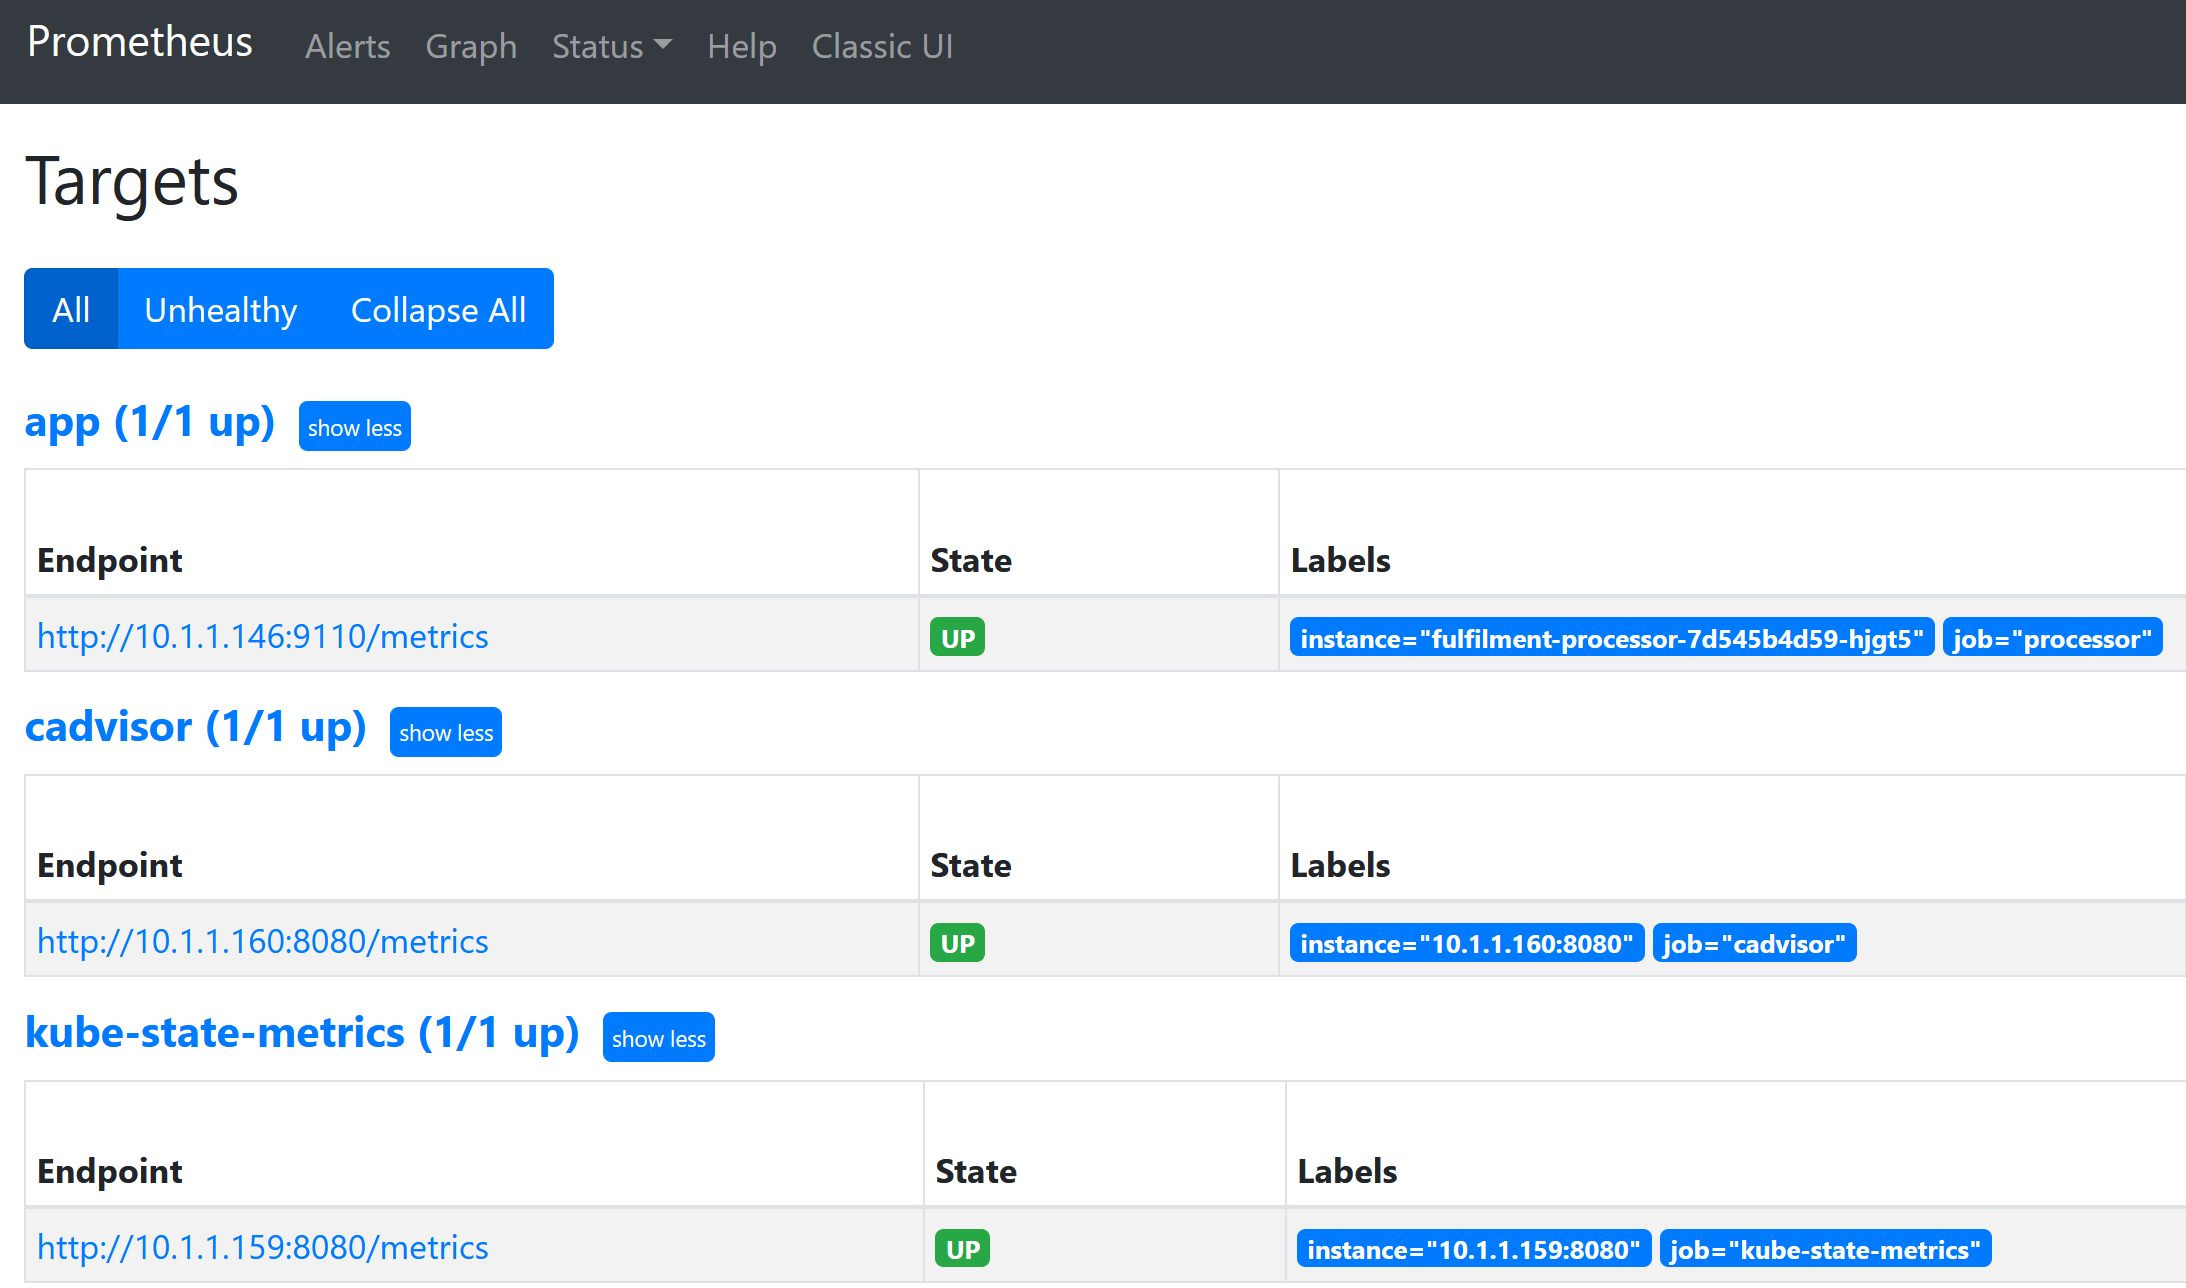
You should see targets like this in Prometheus:
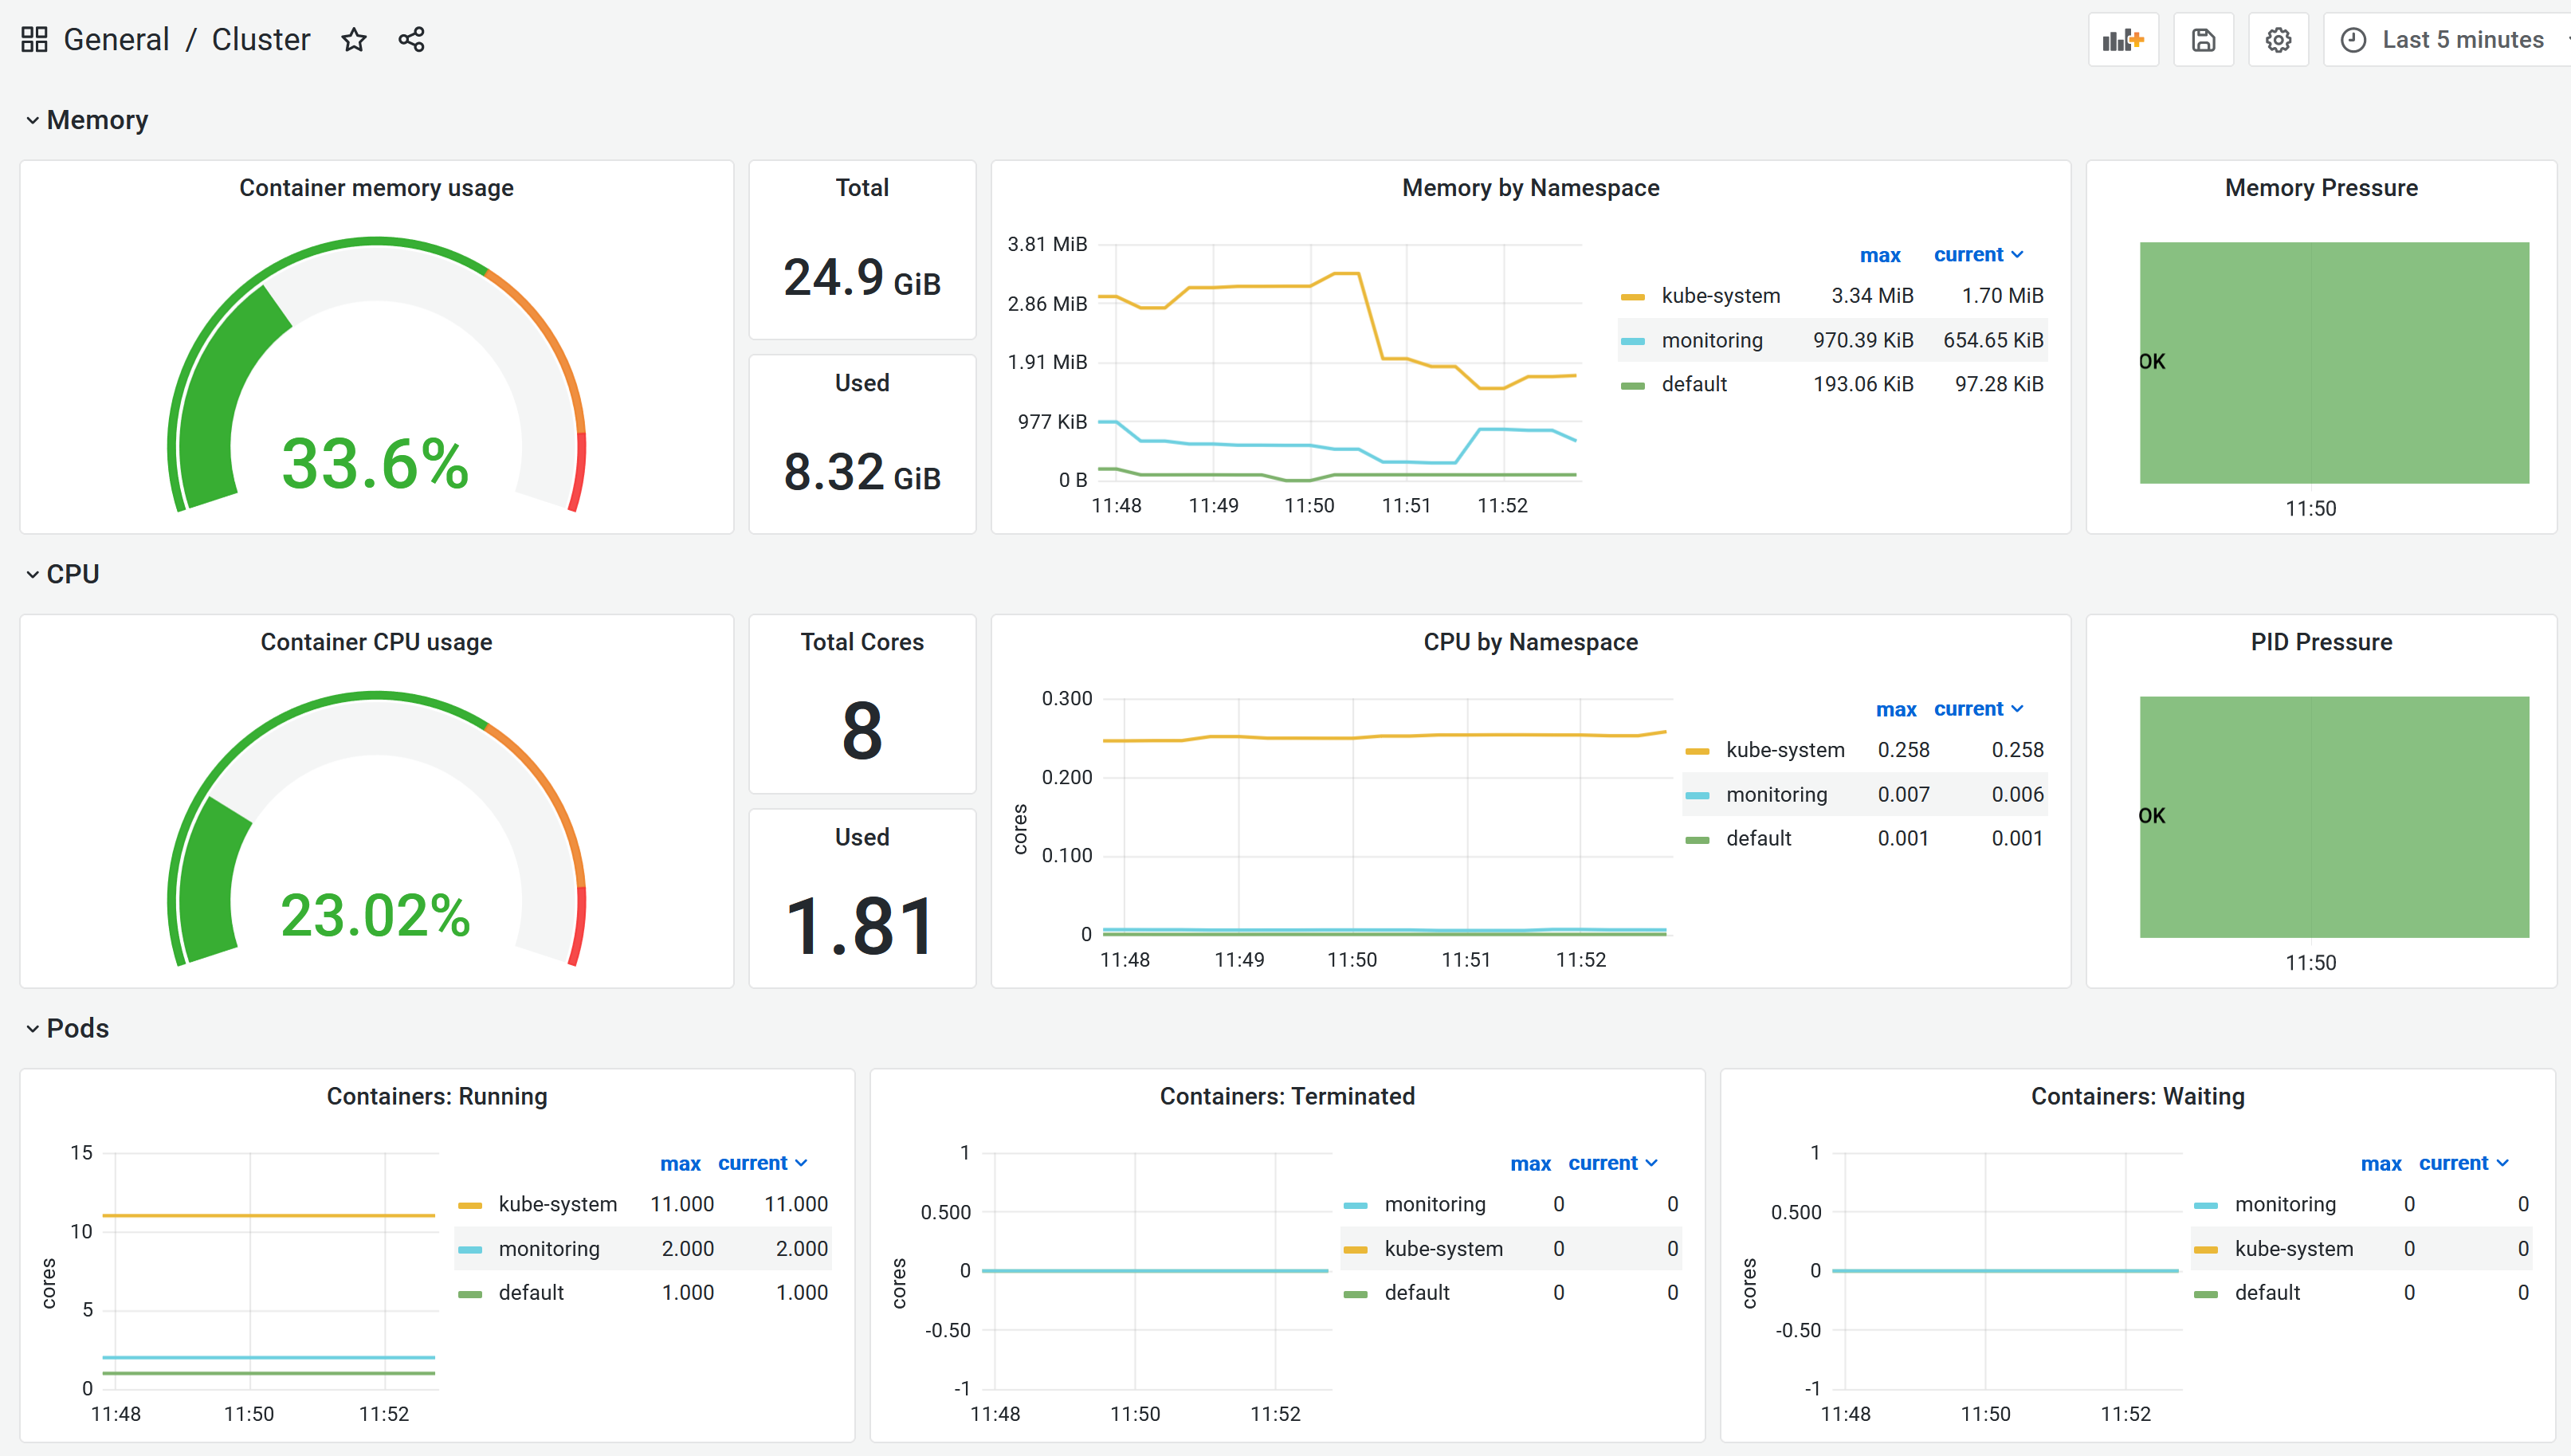
And then you'll see something like this in Grafana:
Cleanup
kubectl delete ns,deploy,svc -l kubernetes.courselabs.co=monitoring

kubectl delete ds,deploy -n kube-system -l kubernetes.courselabs.co=monitoring

kubectl delete clusterrole,clusterrolebinding -l kubernetes.courselabs.co=monitoring